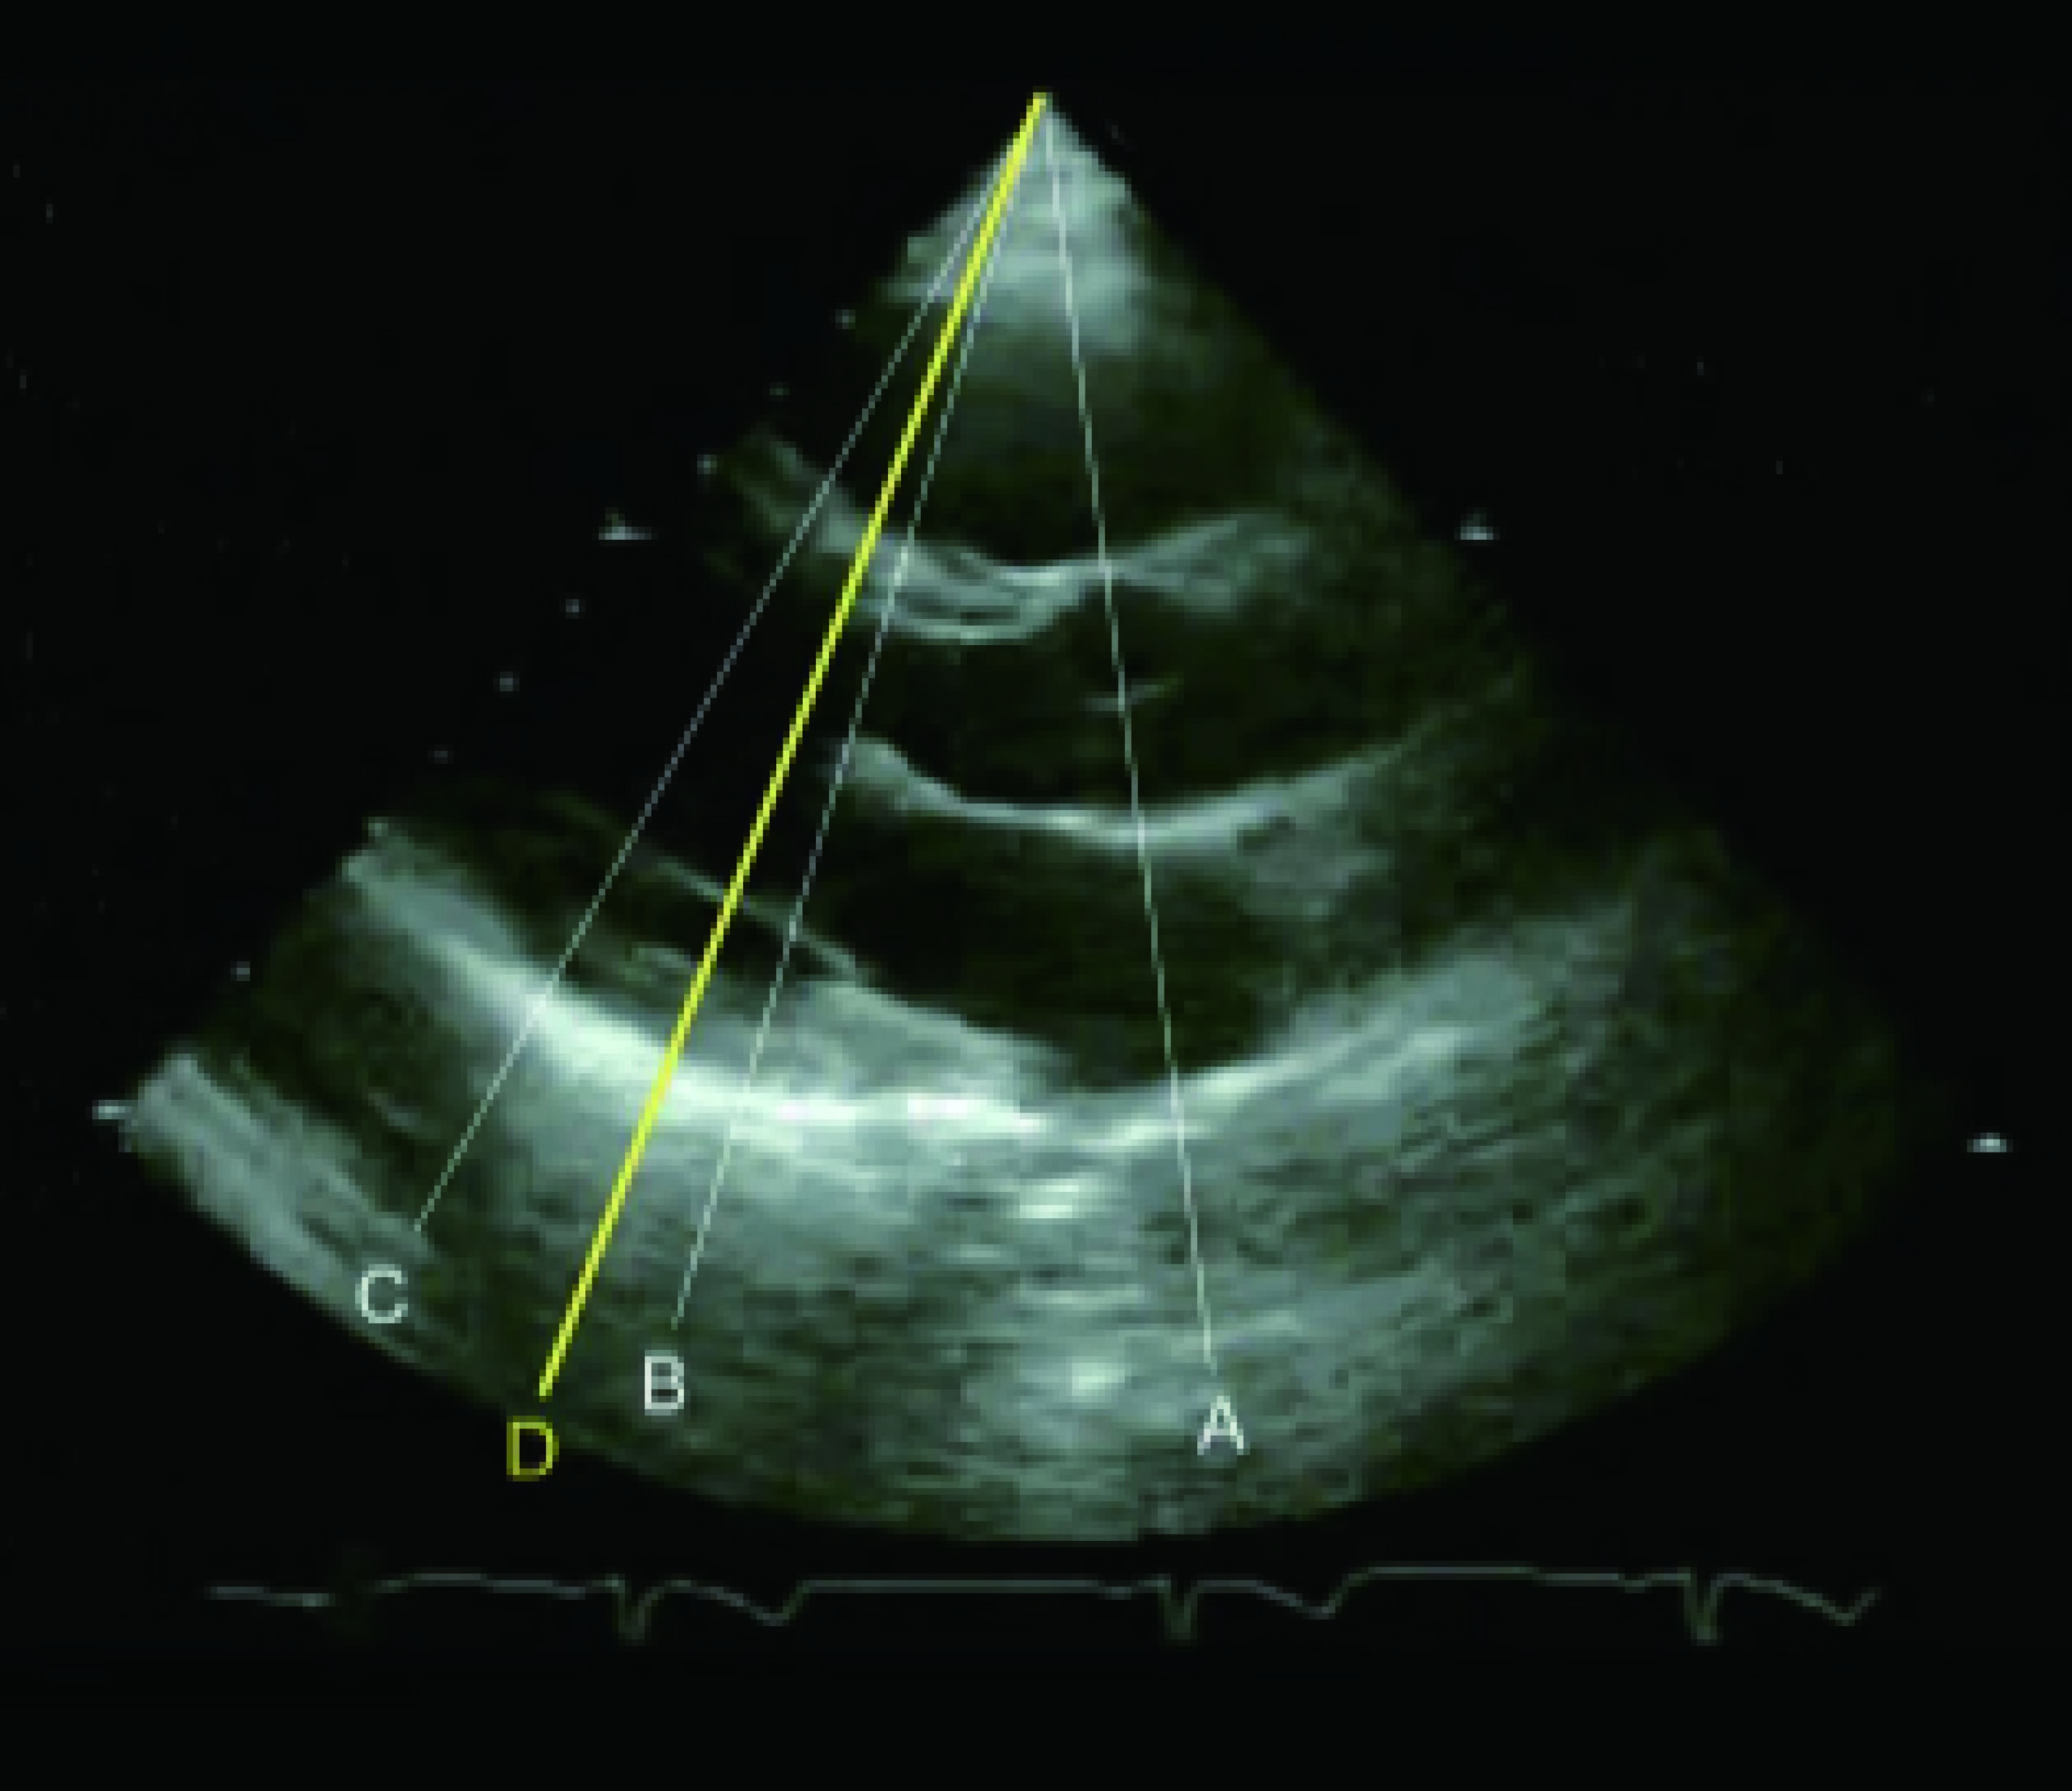
Canine and Feline M-Mode Echocardiography: The ABCDEF Guide
01. Overview
M-mode echocardiography has been clinically applied since 1955. Beyond its conventional use in measuring ejection fraction (EF) for cardiac systolic function assessment, it integrates seamlessly with two-dimensional echocardiography, tissue Doppler, and color Doppler. This integration enables precise evaluation of myocardial thickness, distance, motion velocity, direction, and temporal relationships with the cardiac cycle—making it a powerful tool for time-resolved cardiac imaging. Recommended ultrasound devices for clinical application:PT60, BPU100
.
02. M-Mode Echocardiographic Curves (Left Ventricular Long-Axis View)
Based on the position of the M-mode sampling line, the curves are divided into three groups (A, B, C) as illustrated in Figure 1.

Figure 1
Left ventricular long-axis view (Groups A, B, C)
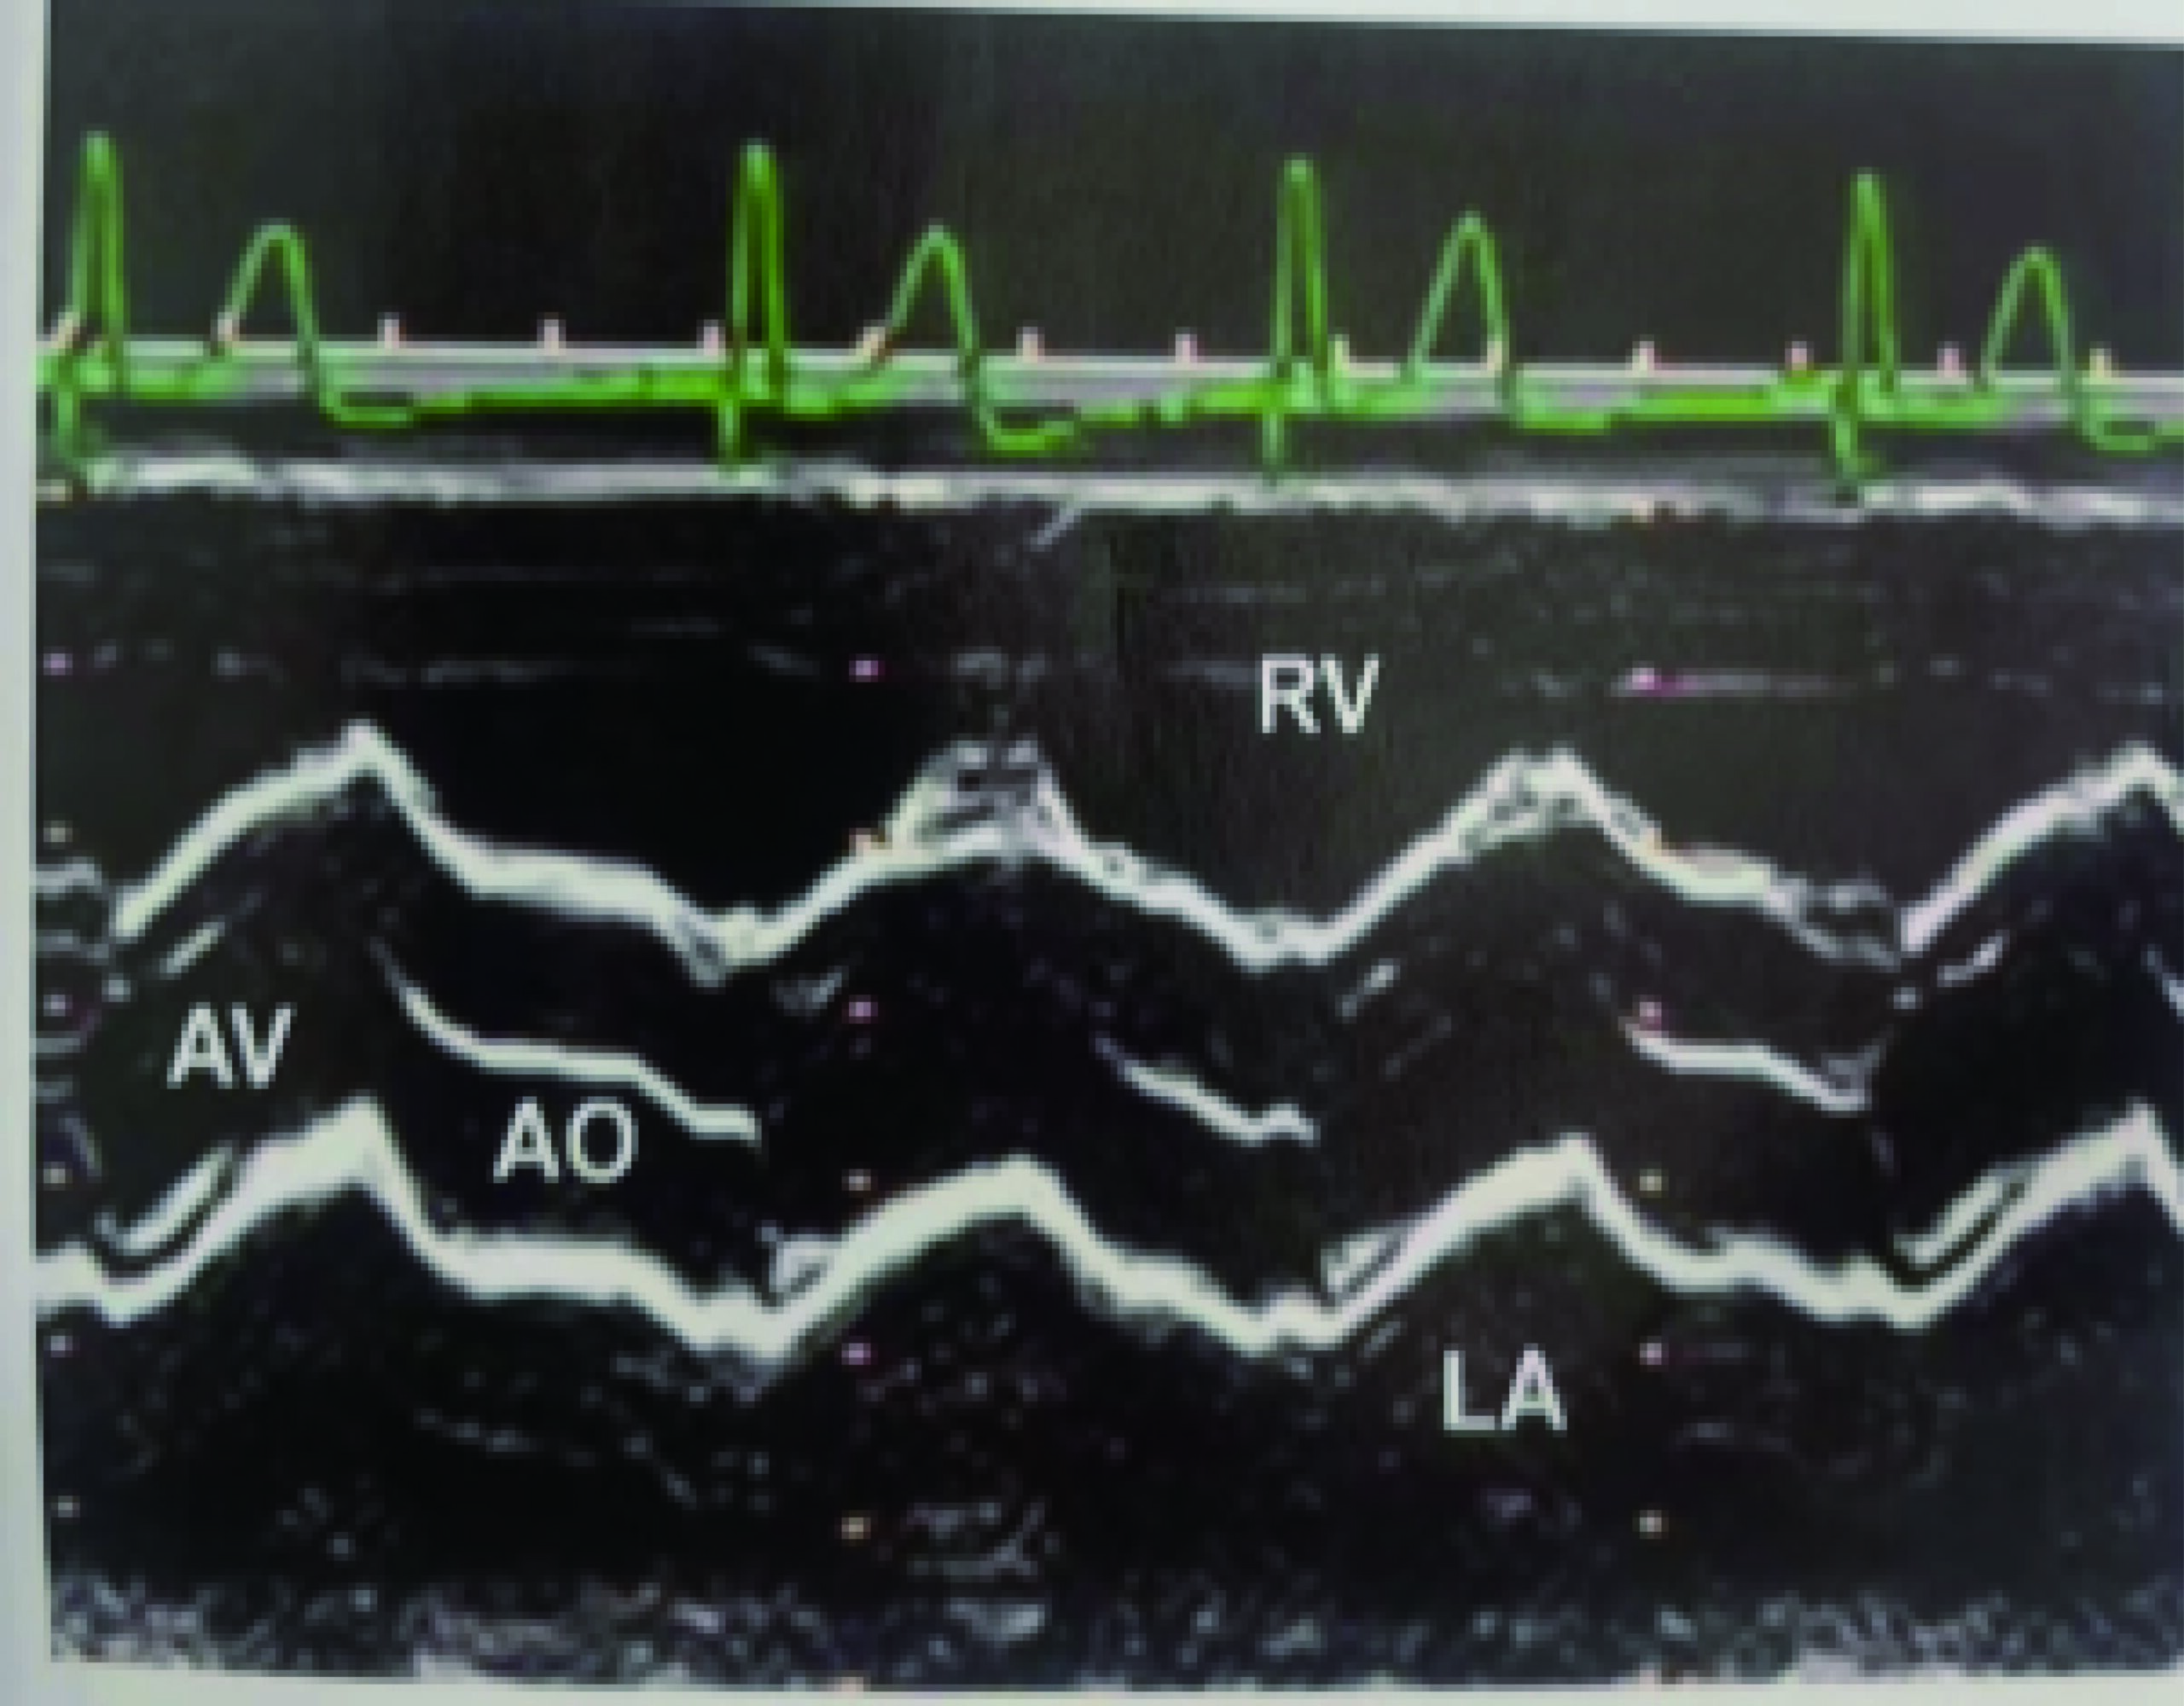
1.Group A: Aortic Root Waveform
- Sampling Line Position: Aligned with the aortic valve level.
- Structures Visualized (Top to Bottom): Right ventricular outflow tract → Anterior aortic wall → Aortic valve → Posterior aortic wall → Left atrium.
- Measurement Standard: All measurements follow the “leading edge to leading edge” principle, performed at end-diastole (standardized to the R-wave peak on the electrocardiogram).
- Key Observations: Evaluate aortic root mobility and elasticity, as well as aortic valve opening amplitude and closure. During systole, the two aortic valve leaflets (right coronary cusp [rcc], non-coronary cusp [ncc]) separate; during diastole, they close to form a single line (Figure 2).

Figure 2
Aortic root waveform
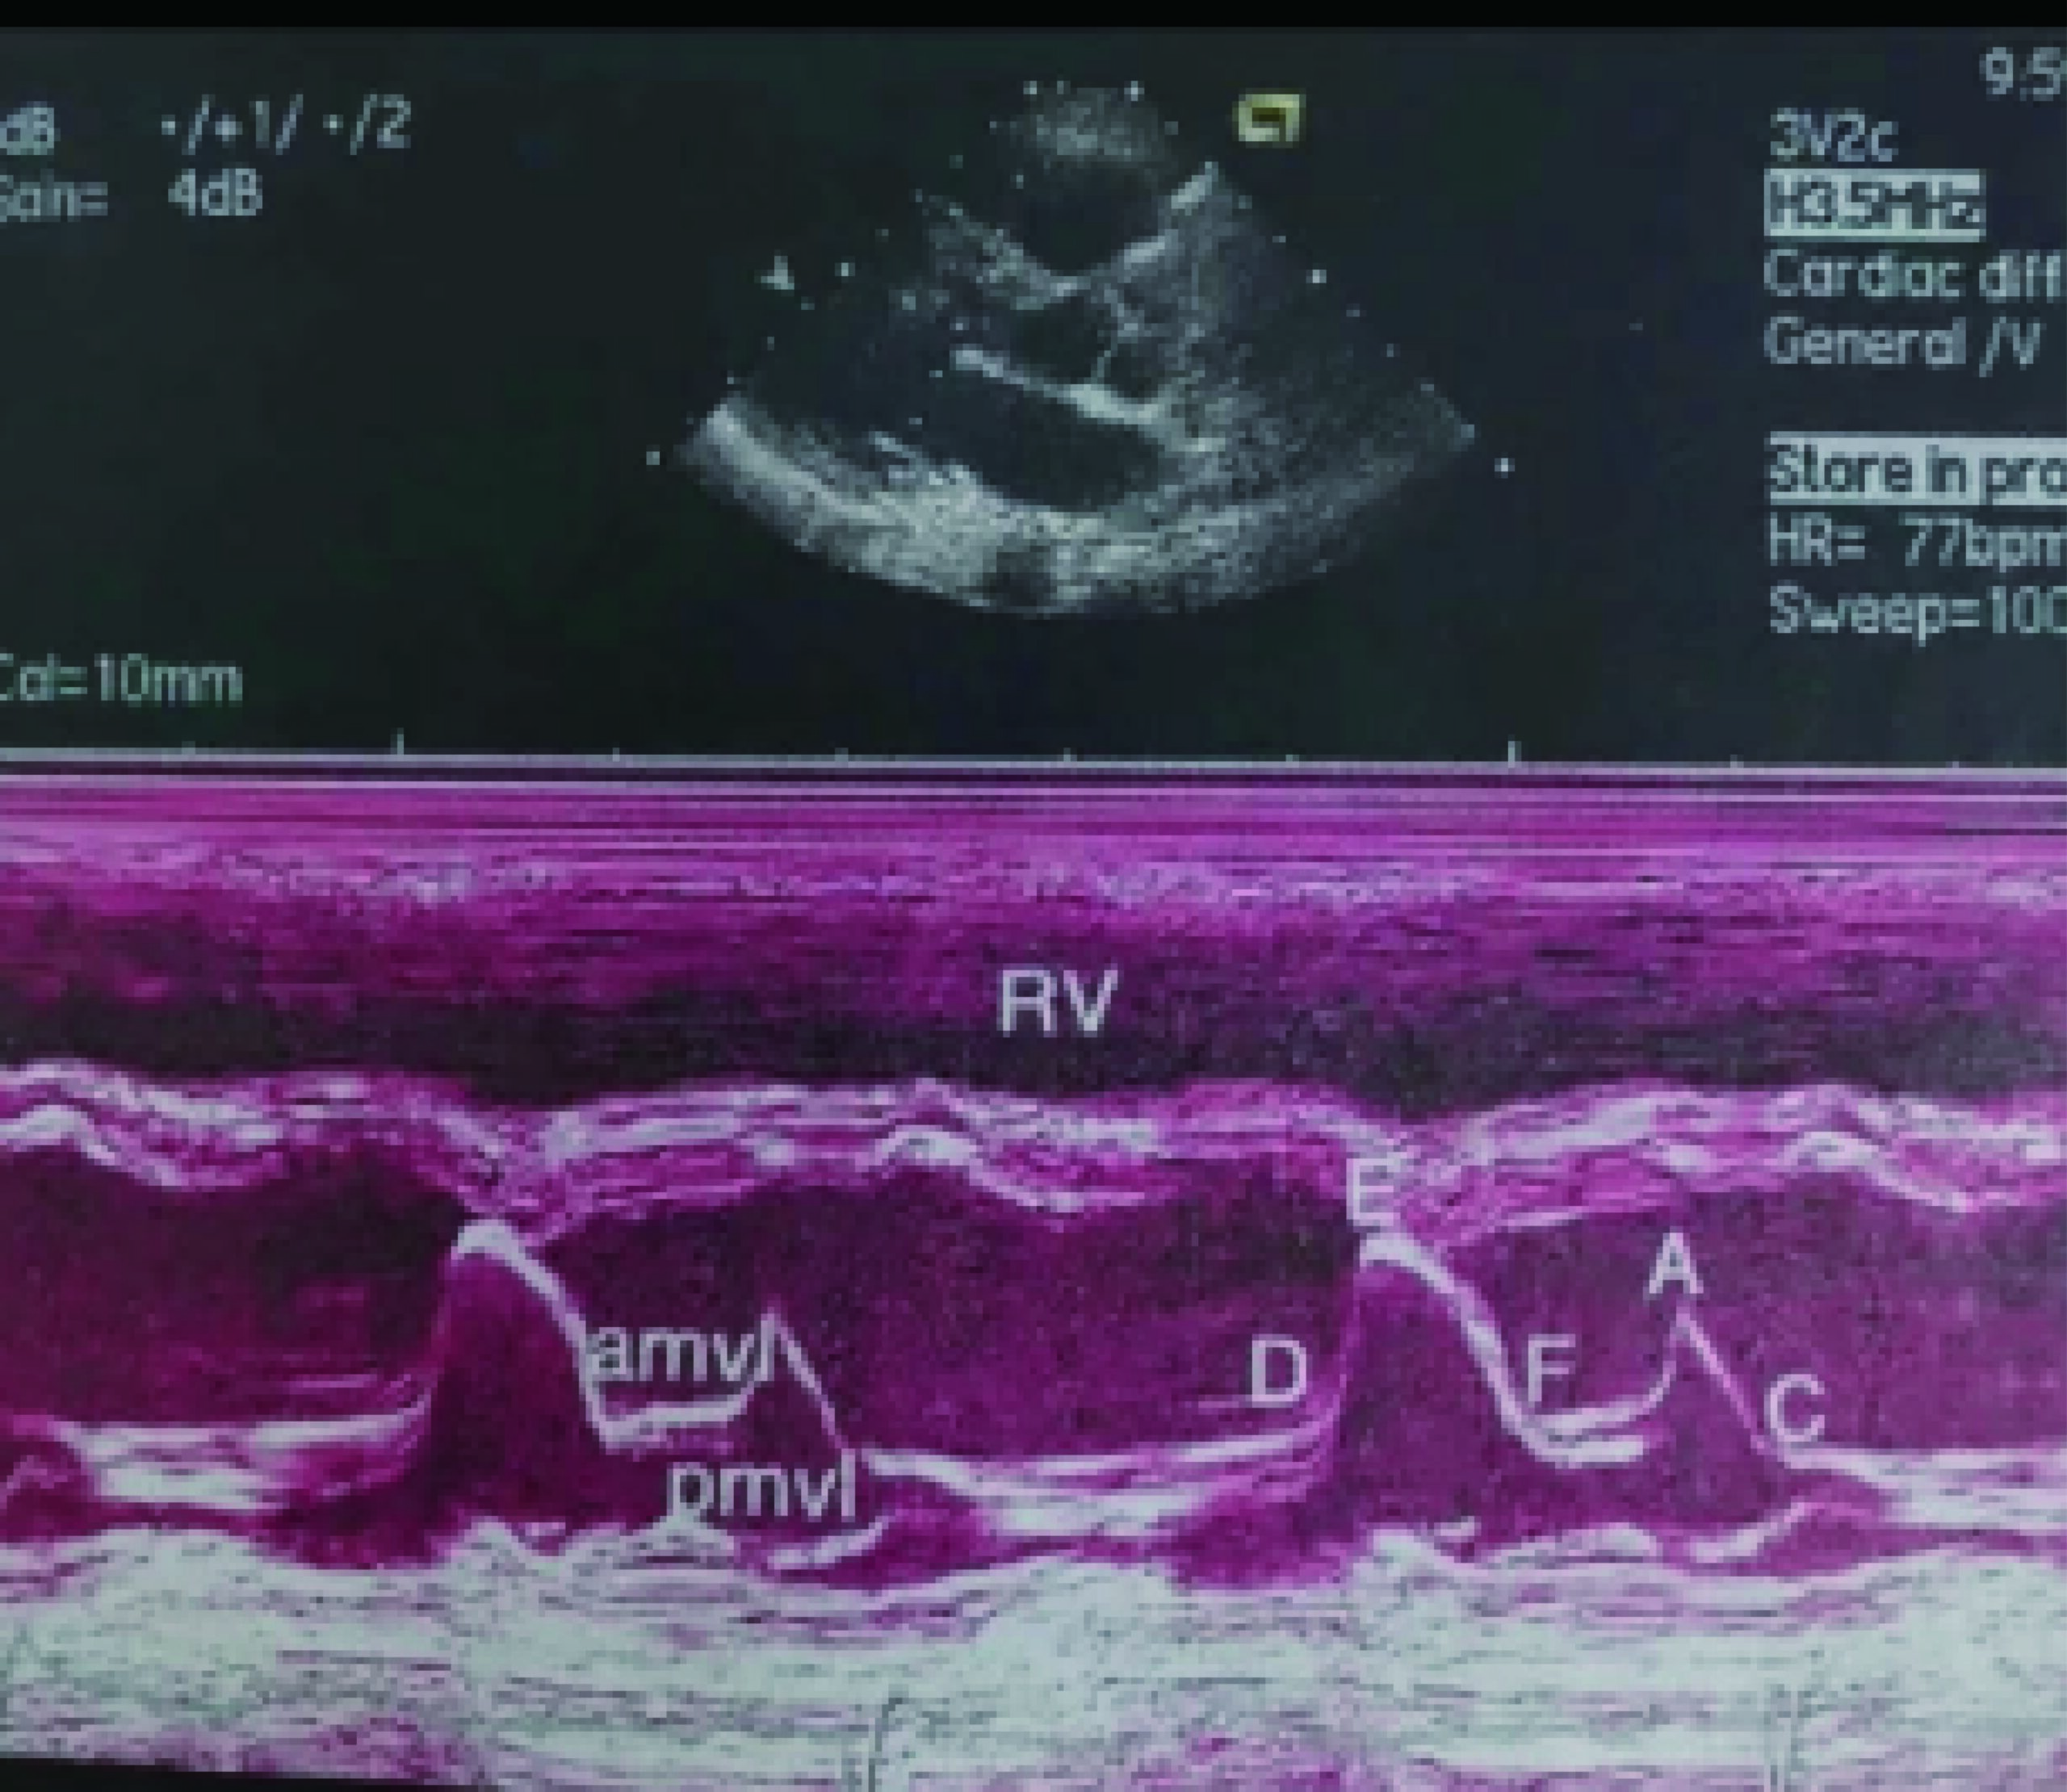
2.Group B: Mitral Valve Waveform
- Structures Visualized (Top to Bottom): Right ventricular anterior wall → Right ventricle → Interventricular septum → Anterior and posterior mitral leaflets → Left ventricular posterior wall.
- A Wave: Corresponding to active ventricular filling during atrial systole; occurs after the P-wave on the electrocardiogram.
- B Point: Represents the secondary opening and closure process of the anterior mitral leaflet.
- C Point: Marks mitral valve closure during systole, coinciding with the first heart sound.
- D Point: Indicates impending mitral valve opening, occurring after the second heart sound.
- CD Segment: Reflects anterior mitral leaflet movement forward with left ventricular posterior wall contraction during systole; serves as the closure line post-diastole, corresponding to the left ventricular ejection phase and aiding in systolic anterior motion (SAM) sign detection.
- E Wave: Represents the rapid filling phase; the anterior mitral leaflet is closest to the interventricular septum at this point. The distance between the E point and the septum (EPSS) is a critical parameter—widened EPSS indicates left ventricular dilation and reduced systolic function. Occurs after the T-wave on the electrocardiogram.
- F Point: The nadir after E wave descent; the descent velocity (EF slope) has a normal range of 80–120 cm/s. A decreased EF slope suggests elevated left ventricular end-diastolic pressure and impaired left atrial emptying.ABCDEF Points of the Anterior Mitral Leaflet Curve (Figure 4):

Figure 3
amv1 (anterior mitral valve leaflet)
Pmv1 (posterior mitral valve leaflet)
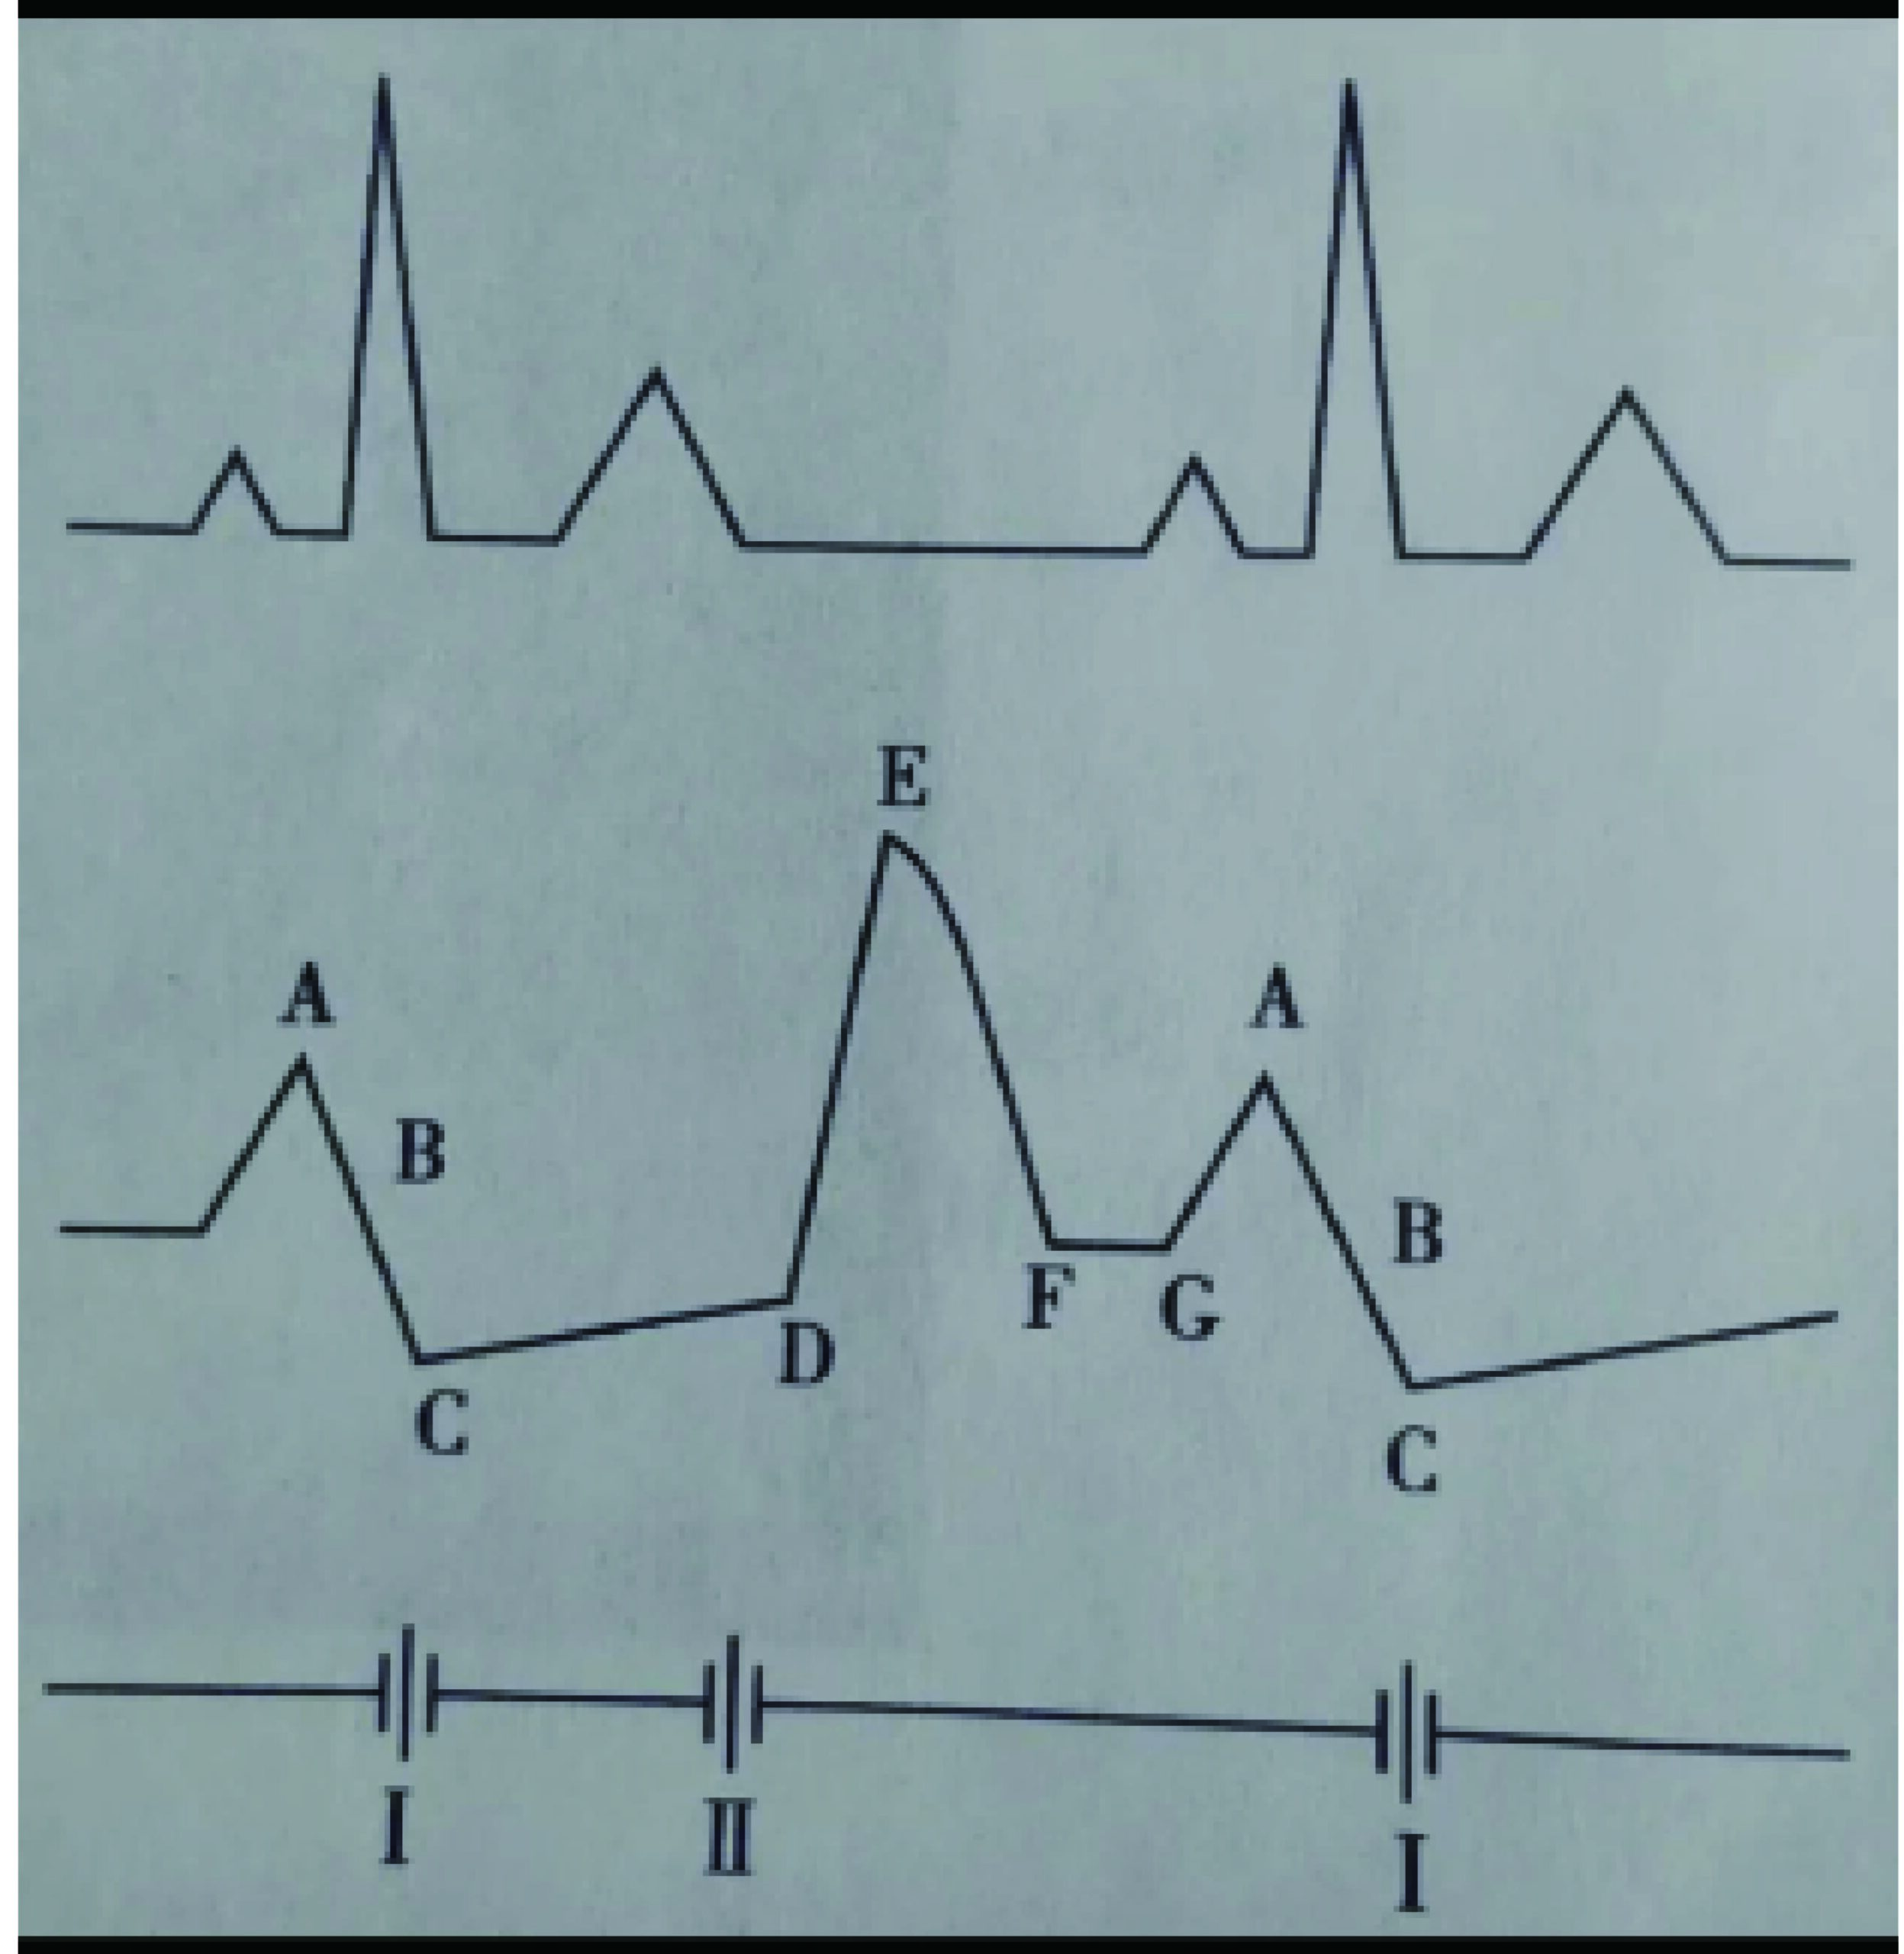
Figure 4
Points A, B, C, D, E, F
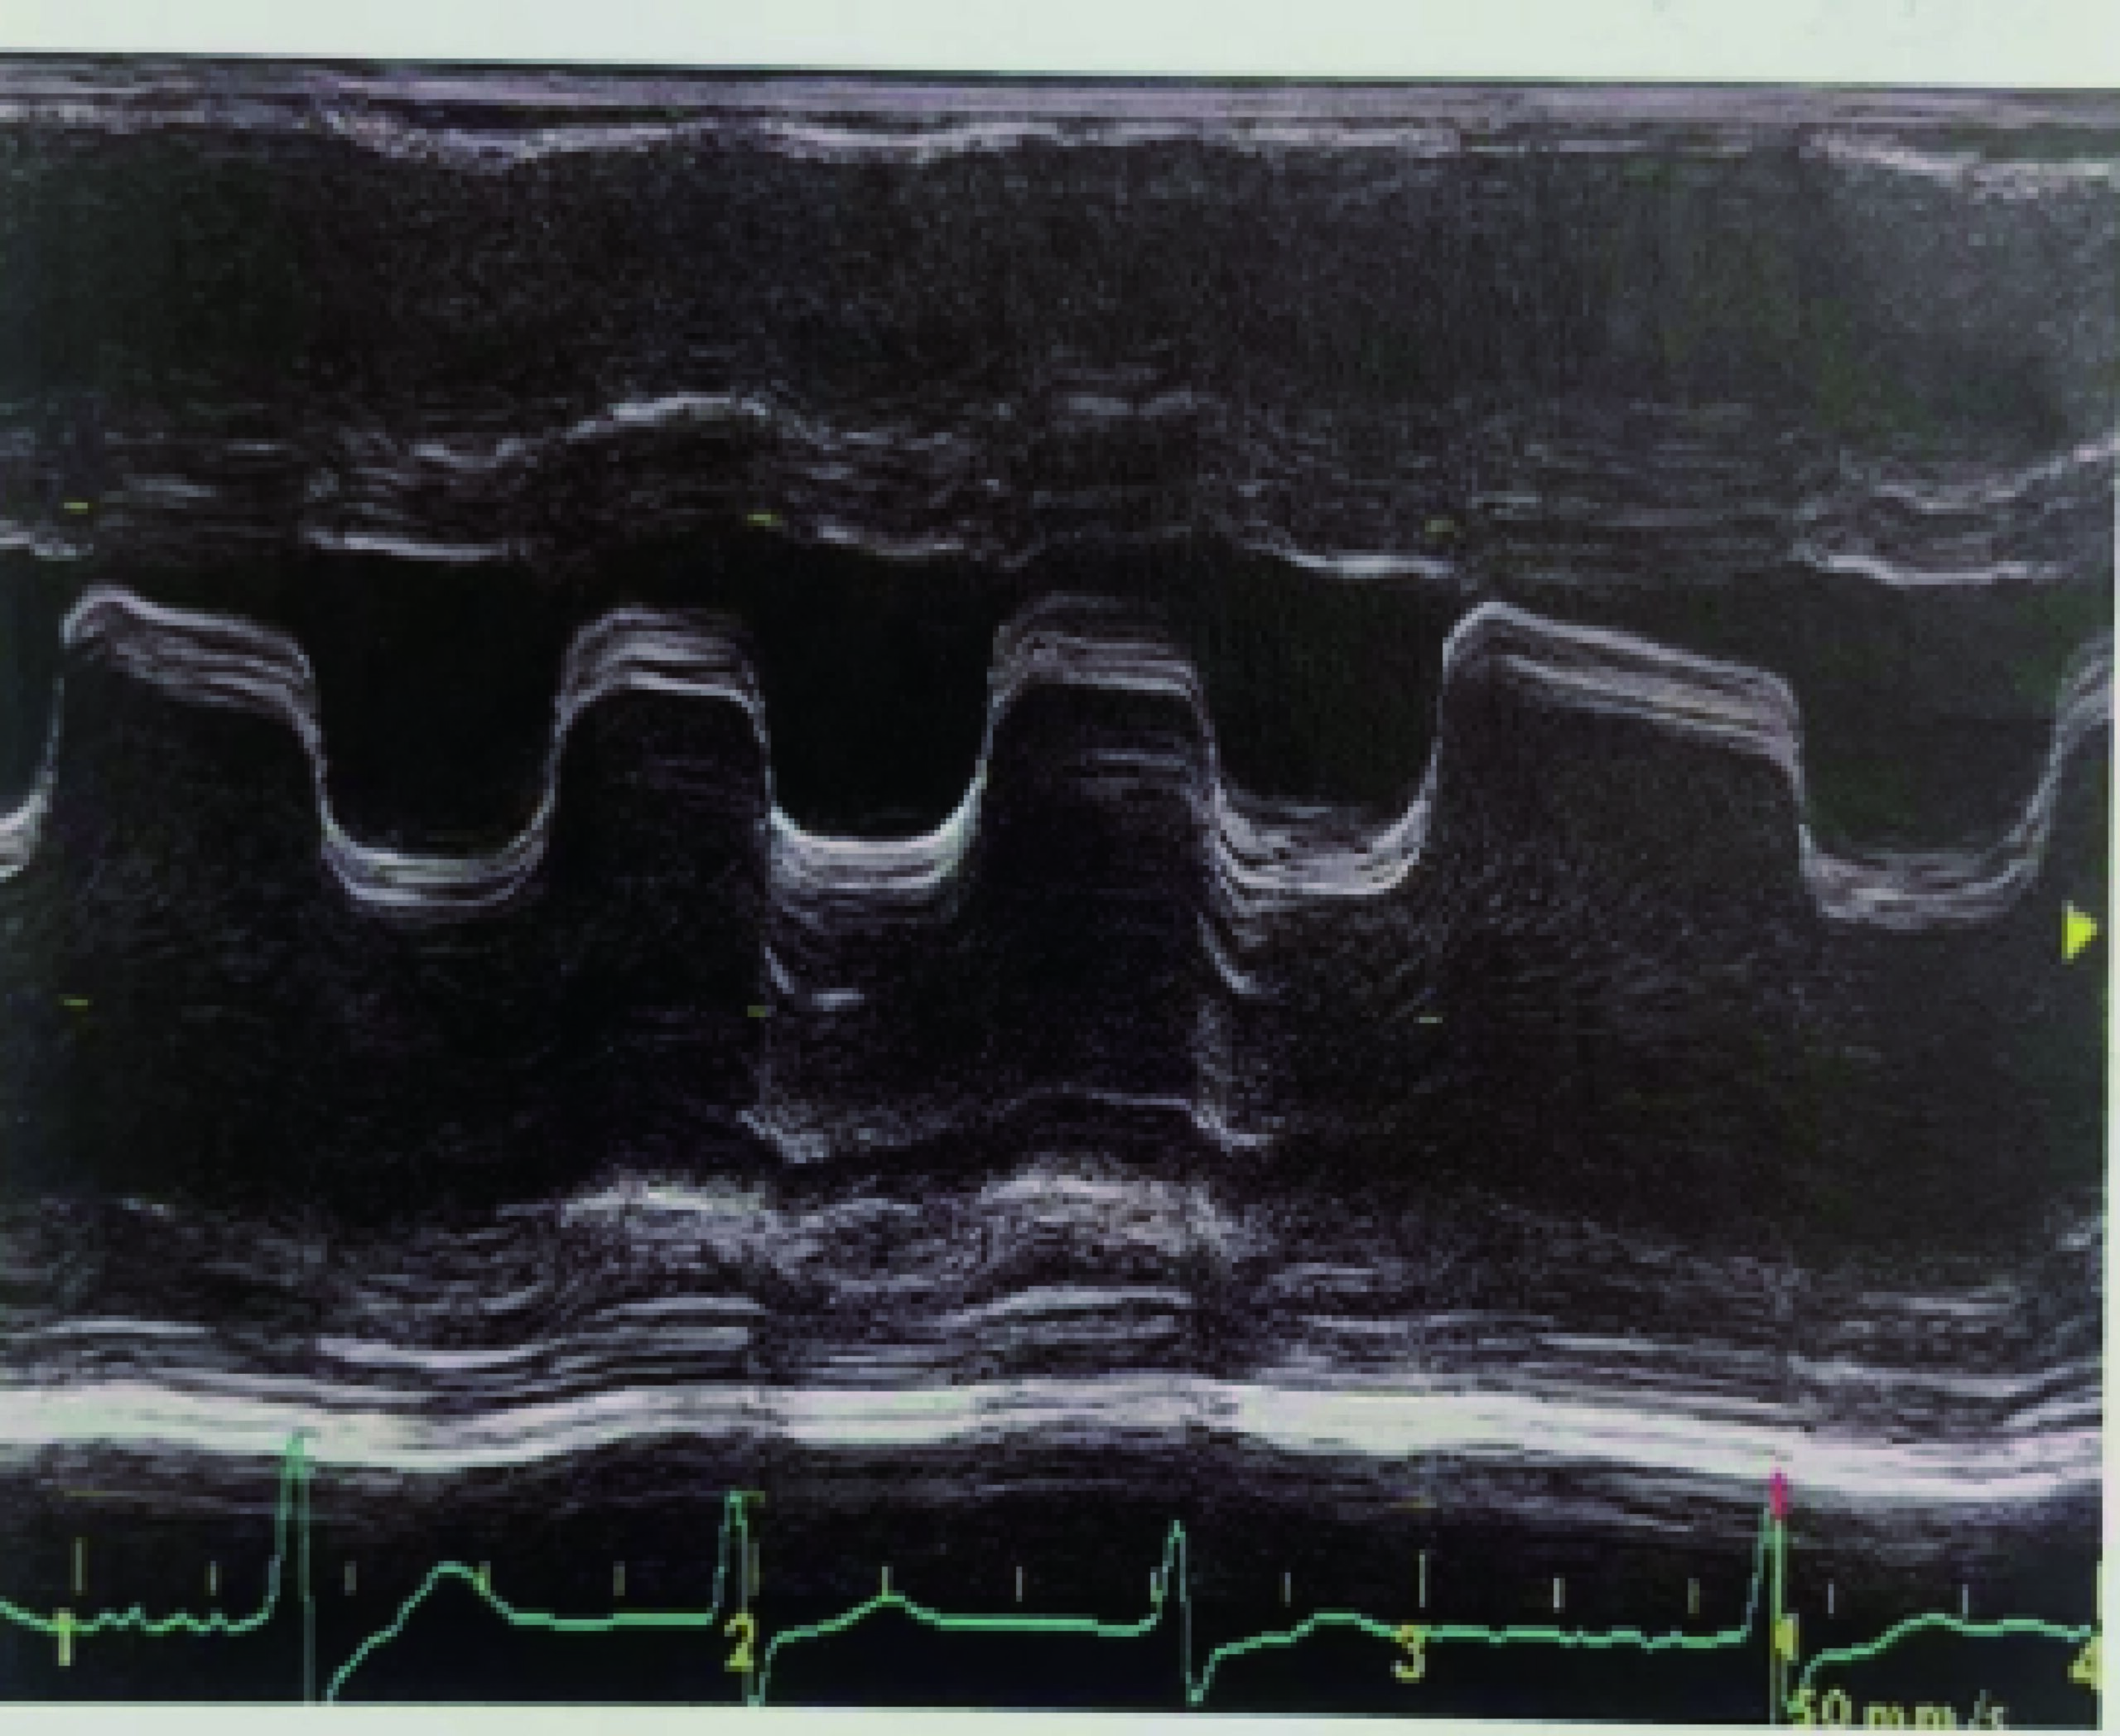
Key Observations:
-
- The posterior mitral leaflet curve is a mirror image of the anterior leaflet.
-
- Mitral stenosis: “Wall-like” curve deformation (Figure 5).
- Mitral regurgitation: Separation of the CD segment.
- Mitral valve prolapse: “Hammock-like” CD segment (Figure 6).
- Obstructive hypertrophic cardiomyopathy: Upward arching of the CD segment due to outflow tract stenosis-induced “siphon effect” (SAM sign, Figure 7).Clinical significance of the CD segment:
- Recommended devices for precise waveform analysis: BPU60C, PT50.

Figure 5
"Wall-like" curve in mitral stenosis
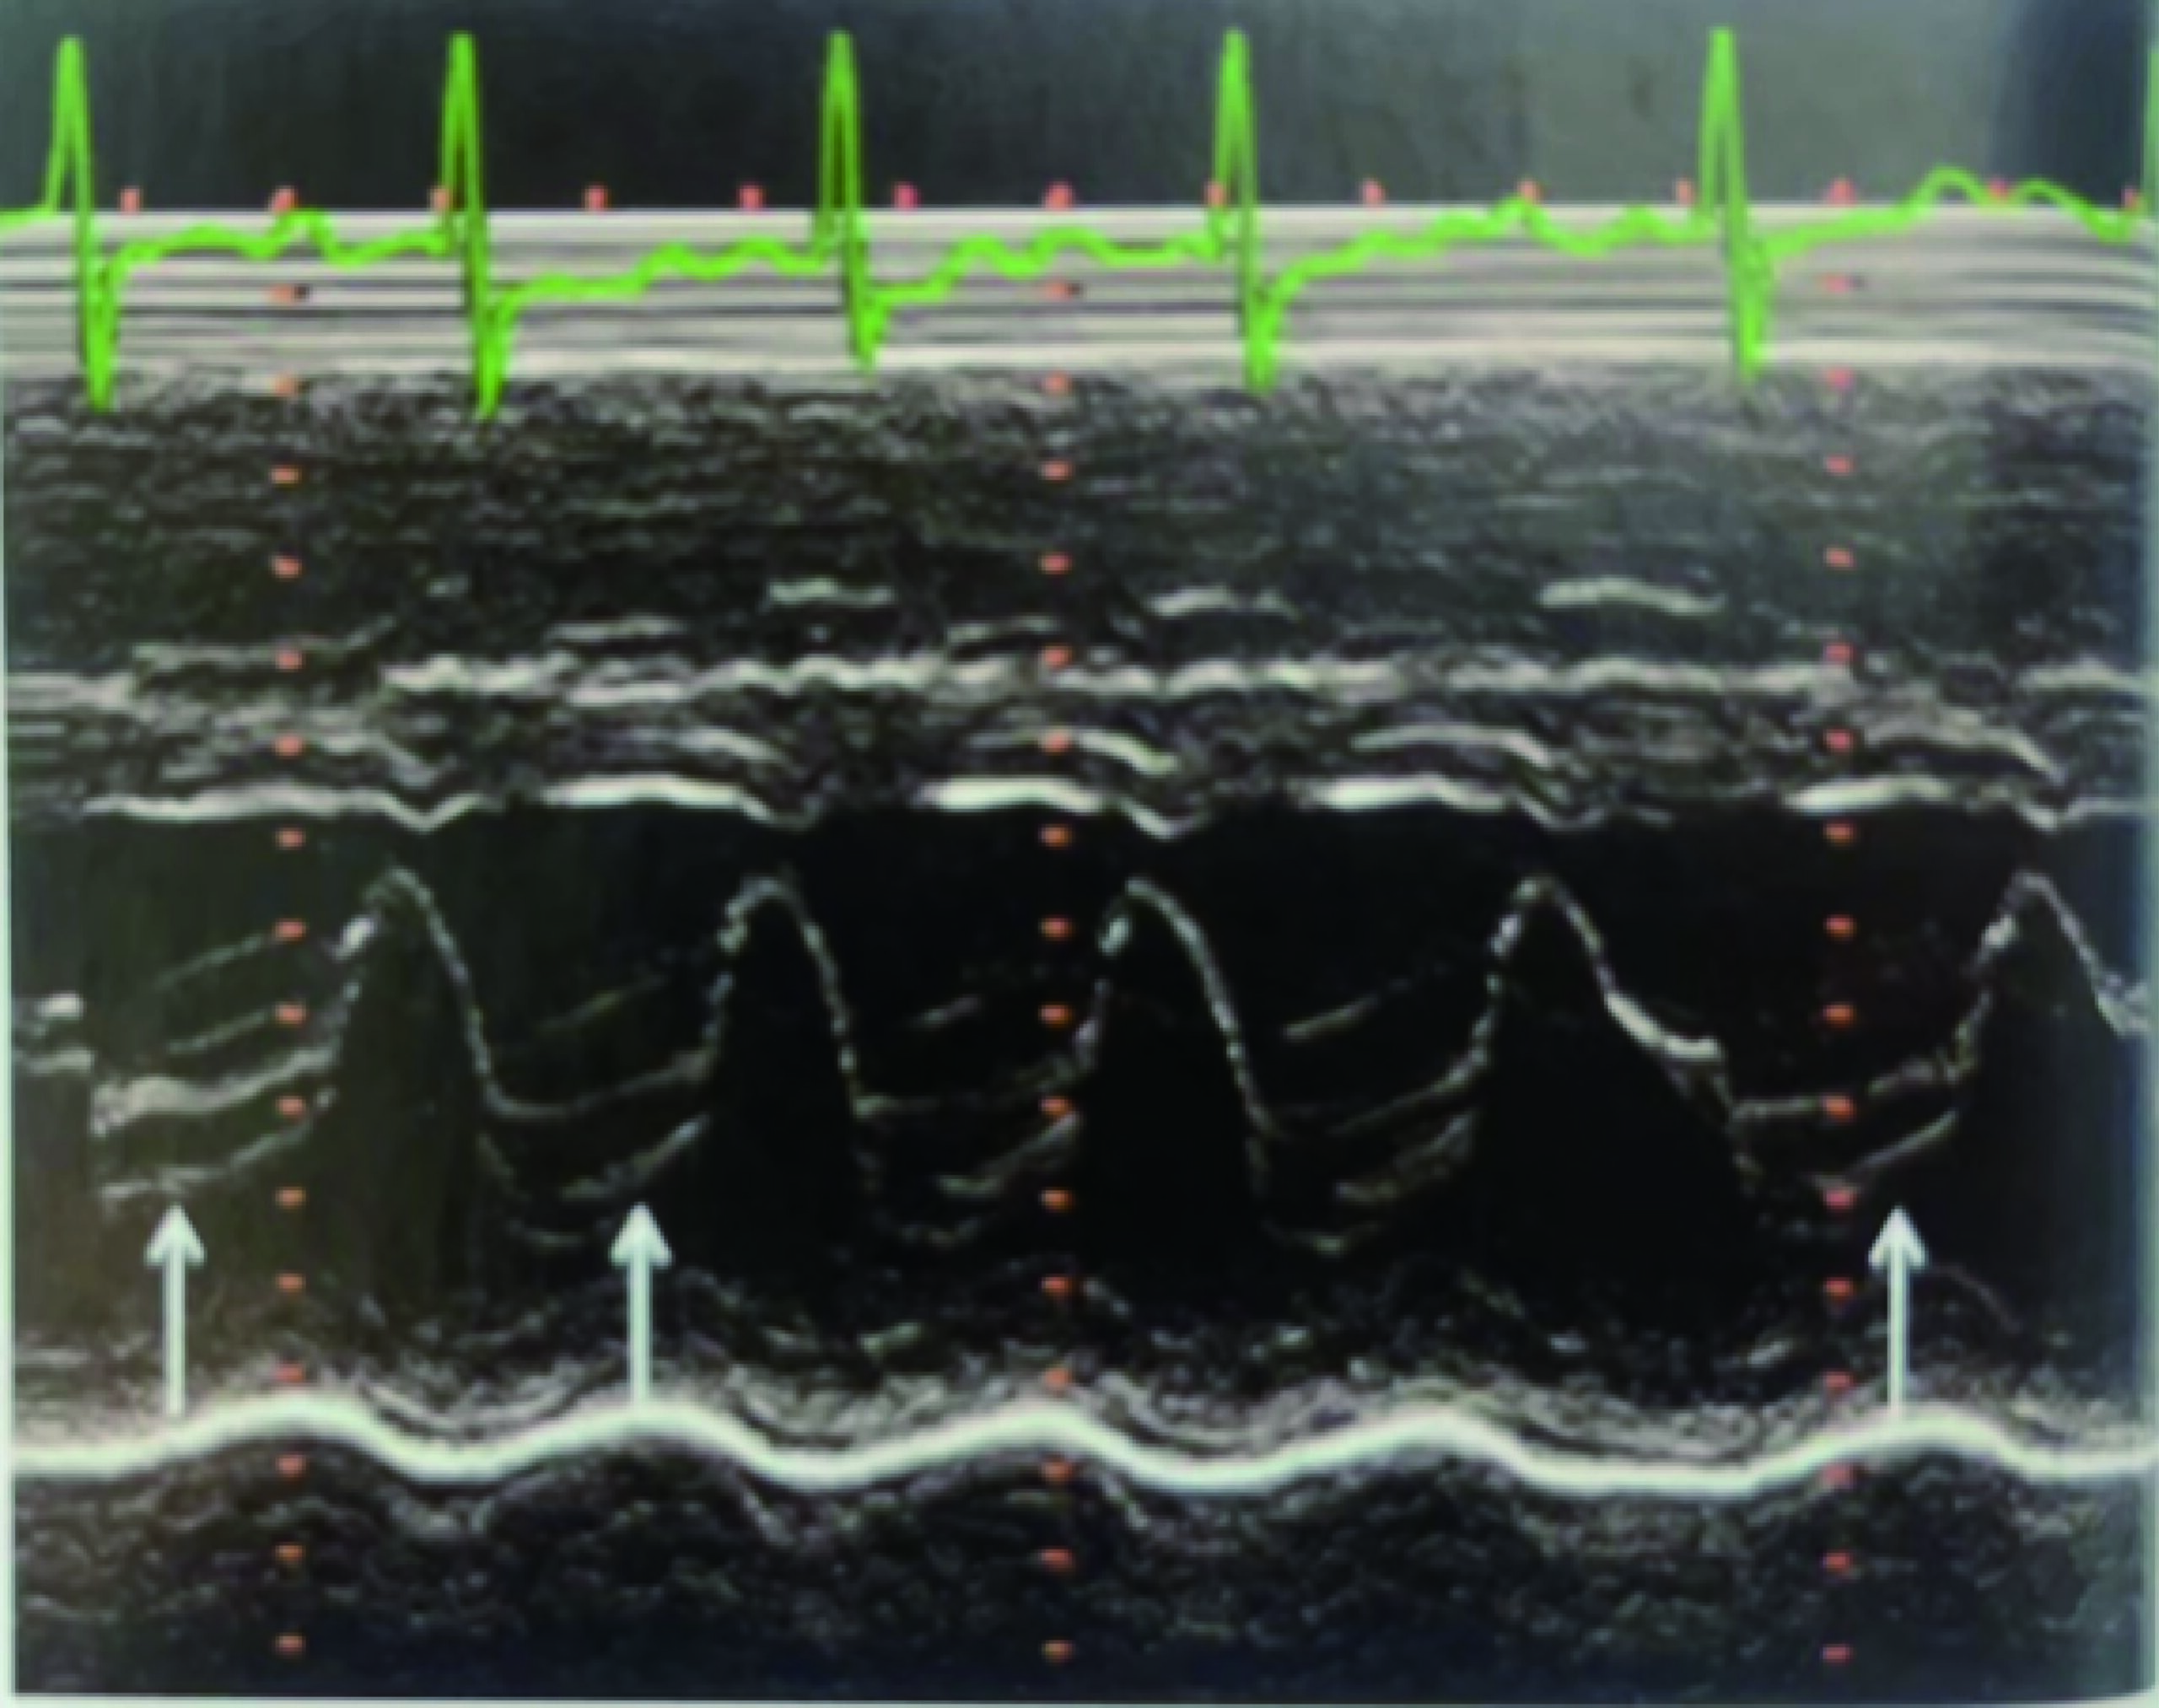
Figure 6
"Hammock-like" curve in mitral valve prolapse
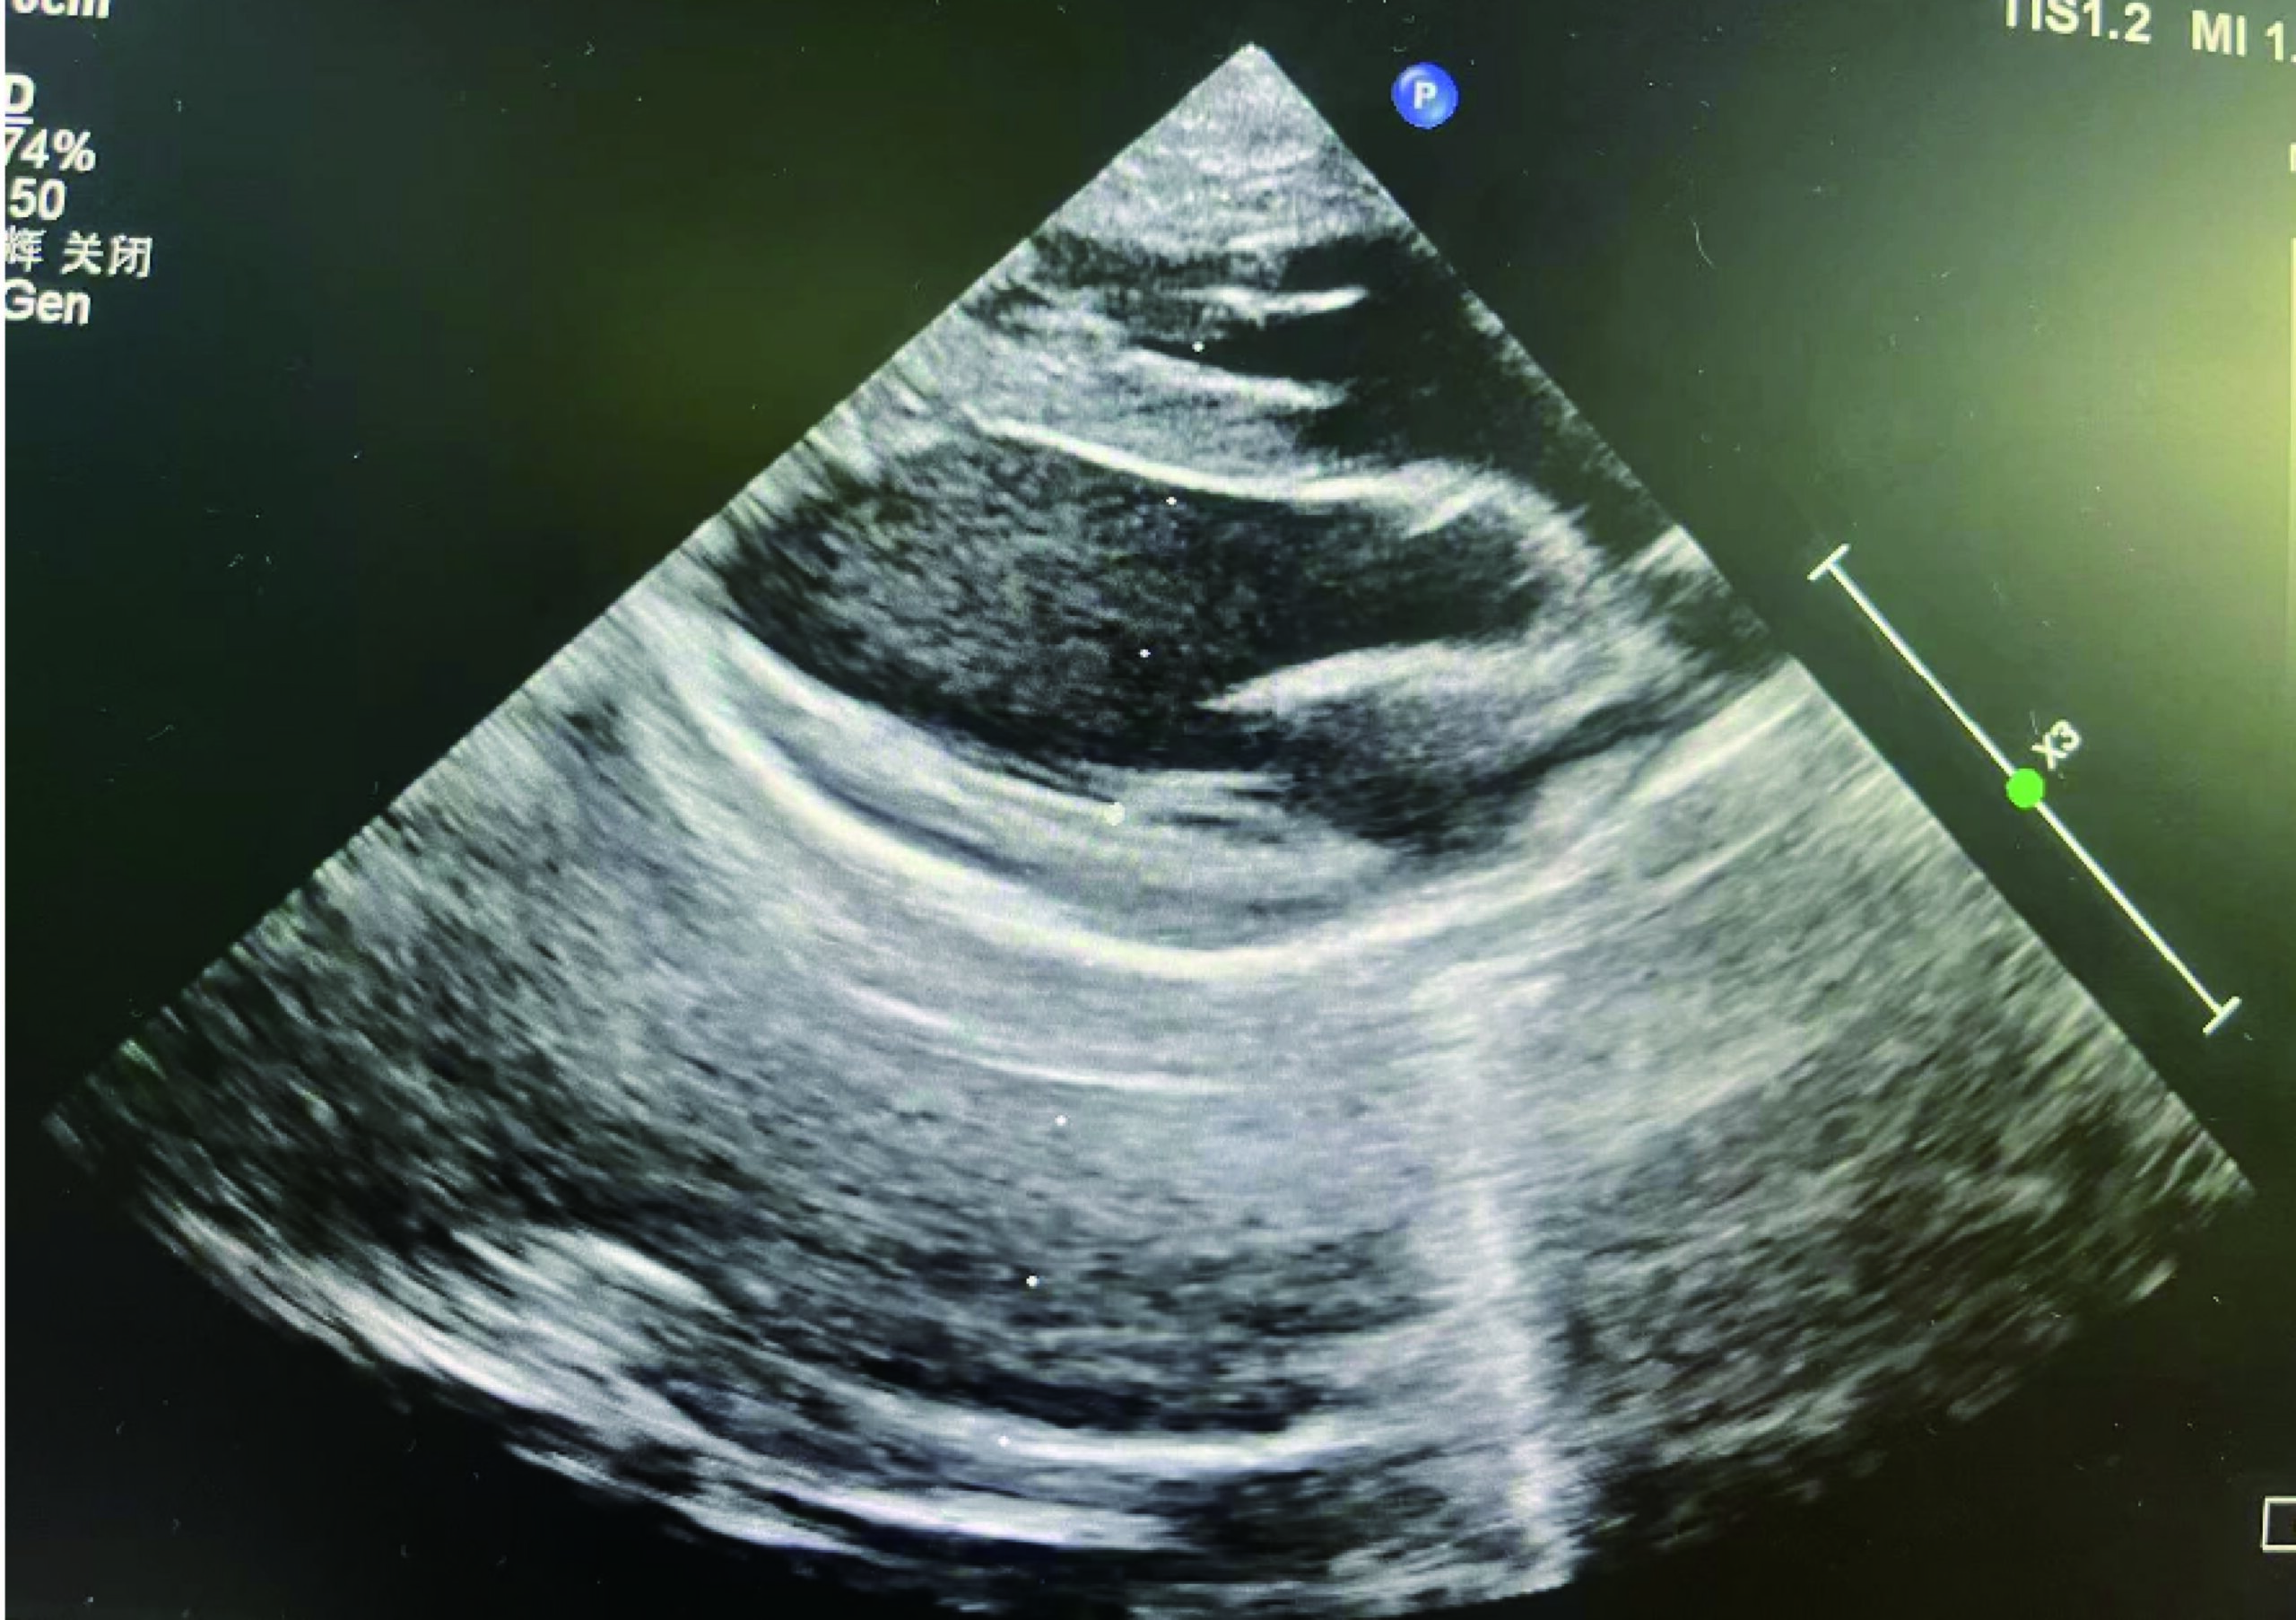
3.Group C: Ventricular Waveform
- Sampling Line Position: Aligned with the chordae tendineae level (Figure 8).
- Structures Visualized: RV (right ventricle), IVS (interventricular septum), LVPW (left ventricular posterior wall), LV (left ventricle).
- Clinical Applications:
- Standard measurement site for EF, myocardial thickness, ventricular cavity size, and endocardial motion amplitude.
- Assessment of right ventricular volume load (right ventricular enlargement) and pericardial effusion quantification.
- Optimal device for quantitative analysis: BPU50 ultrasound.

Figure 8
M-mode sampling line positioning at the chordae tendineae level (left ventricular long-axis view)


